Introduction
The following sections cover the basic functionalities and features of Pyplan. Pyplan is in permanent evolution, so you will probably find minor differences between this document and the last Pyplan version running online.
What you will find in this User Guide
The User Guide has been structured in the following sections:
Pyplan App Homepage
Where the application’s main menu and tools are described.
File Manager
Users have their own workspace and can also access a Public workspace. The File manager provides assistance for working with files related to your applications.
Model
Pyplan organizes Python code in nodes that are represented as a workflow (influence diagram.) In this section, all the tools and features created for helping you build the calculation and data manipulation logic are explained.
Visualization
Calculation steps are contained in nodes that end with a result. These nodes can be evaluated, and their result can be displayed as a table, graph or map. All native Pyplan visualization alternatives and parameter configurations are described in this section. It is important to highlight that it is also possible to use many other visualization libraries available in Python, like Bokeh or Plotly for rendering results.
Interface Designer
Visualization and user controls are grouped in interfaces which allow the user to interact with your app and explore the results. In this chapter, we will explain how to create, configure, and share these apps. Most importantly: no coding required!
Configuration and User Management
The enterprise version of Pyplan is installed on a server or provided as a service through Amazon Elastic Cloud. In this section, we will explore the app’s architecture and how to administer users in terms of security and resources.
Tutorials, Examples and Demos
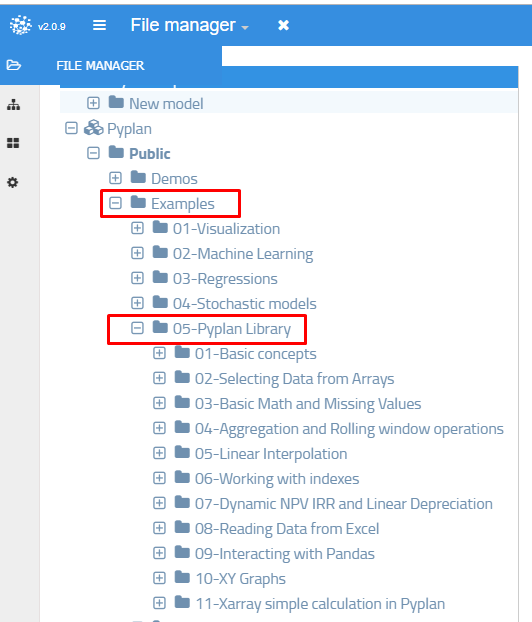
In the Public folder that you can access through the File manager, you will find many Pyplan models grouped as Tutorials, Examples and Demos. Tutorials are basic examples that illustrate how Pyplan natively handles and interact with Python objects. The Examples are intended to demonstrate what can be done with Pyplan. You can review its code to understand how to adapt or reuse any piece of code in your own project. In the Demos folder, you will find complete applications related to certain topics and/or industries.
What you will NOT find in this User Guide
Pyplan can be considered a Python integrated development environment for data analytics apps. This User Guide is not intended to explain how to program in Python, or in any of the other used libraries, like Pandas, Numpy or Xarray just to name a few. There are plenty of introductory tutorials and courses for you to learn from. The libraries’ own documentation is always a good source of information, and for any challenging task you can also count on the community help gathered in sites like StackOverflow.
Formerly Cubeplan users
Pyplan is the software evolution of Cubeplan. Improvements were so radical that required a change in the name of the product. However, in order to make it easy for former Cubeplan users to migrate to Pyplan, we have created a library that reproduces, as similar as possible, Cubeplan functions and syntax. Cubeplan models cannot be run in Pyplan. A good way to learn how to use Python is to migrate an existing Cubeplan model.
Pyplan Library correlation with Cubeplan
Check examples available in Pyplan Library folder to see how things you did in Cubeplan are now done using Pyplan .

The following table contains Cubeplan basic function list and its correlation in Pyplan.
| Model | Title in Cubeplan | Pyplan Library | Node with example | PPL,XA or Pandas |
|---|---|---|---|---|
| Selecting Data from Array | change index | change_index | change_index_ex /change_index_by_pos_ex | PPL |
| Selecting Data from Array | subscript | subscript | subscript_ex | PPL |
| Selecting Data from Array | subscript looking up | lookup | lookup_ex | PPL |
| Selecting Data from Array | subset | subset | subset_ex | PPL |
| Selecting Data from Array | slice | slice_dataarray | slice_dataarray_ex | PPL |
| Basic Math and Missing Values | size | len() | len_size_ex | XA |
| Basic Math and Missing Values | size | dataarray.size | len_size_ex | XA |
| Basic Math and Missing Values | undef_filter | fill_all | fillall_ex | PPL |
| Basic Math and Missing Values | nvx_is_null/nvx_is_nan | dataarray.fillna() | missing_values_methodsfillna | XA |
| Basic Math and Missing Values | undef_filter | fill_inf | fillinf_ex | PPL |
| Basic Math and Missing Values | min | dataarray.min(teams.name) | min_along_indexes | XA |
| Basic Math and Missing Values | max | dataarray.max(teams.name) | max_along_indexes | XA |
| Basic Math and Missing Values | if then else | xr.where | xr_where_exa | XA |
| Basic Math and Missing Values | min_ | xr.ufuncs.minimum | mini_maxi_among_2_dataarrays | XA |
| Basic Math and Missing Values | max_ | xr.ufuncs.maximum | pp_maximum | XA |
| Aggregation and Rolling window operations | sum | dataarray.sum(teams.name) | sum_ex | XA |
| Aggregation and Rolling window operations | cumulate | dataarray.cumsum(teams.name) | cumsum_ex | XA |
| Aggregation and Rolling window operations | cumproduct | dataarray.cumprod(teams.name) | cumprod_ex | XA |
| Aggregation and Rolling window operations | backward looking sum | dataarray.rolling | back_look_sum_example | XA |
| Aggregation and Rolling window operations | filtered aggregate | aggregate | aggregate_ex | PPL |
| Working with Indexes | concat | concat_index | concatindex_ex | PPL |
| Working with Indexes | new | add_periods_ex | add_periods_ex | PPL |
| Working with Indexes | new | apply_fn | apply_fn_ex | PPL |
| Working with Indexes | find in text | find | find_ex | PPL |
| Working with Indexes | splittext | split_text | splittext_ex | PPL |
| Dynamic NPV IRR and Linear Depreciation | npv | npv | npv_ex | PPL |
| Dynamic NPV IRR and Linear Depreciation | irr | irr | irr_ex | PPL |
| Dynamic NPV IRR and Linear Depreciation | dynamic | dynamic | dynamic_ex | PPL |
| Dynamic NPV IRR and Linear Depreciation | new | create_time | time | PPL |
| Dynamic NPV IRR and Linear Depreciation | linear depreciation | linear_depreciation | linear_depreciation_ex | PPL |
| Dynamic NPV IRR and Linear Depreciation | or | ¦ | NA | XA |
| Reading Data from Excel | nvx_da_source_cone | excel_connection | excel_connection_ex | PPL |
| Reading Data from Excel | nvx_read_index | index_from_excel | reading_example_index | PPL |
| Reading Data from Excel | nvx_read_table | dataarray_from_excel | dataarray_from_excel_ex | PPL |
| Reading Data from Excel | nvx_read_table | pandas_from_excel | pandas_from_excel_ex | PPL |
| Interacting with Pandas | new | pd.read_csv | pd_read_csv | Pandas |
| Interacting with Pandas | new | index_from_pandas | orders_date | PPL |
| Interacting with Pandas | new | reading from pandas see example | sales_data_by_orders_date | XA |
Financial Planning Library for Cubeplan users
If you are used to create financial planning models in Cubeplan then these other functions will be useful for you.
Contact your former Cubeplan distributor to ask for the module with these specific functions.
| Module | Title in Cubeplan | Pyplan Library |
|---|---|---|
| Financial Planning | sea_to_time | sea_to_time |
| Financial Planning | annualise | annualise |
| Financial Planning | month | month |
| Financial Planning | evatime | evatime |
| Financial Planning | new | days_to_time |
| Financial Planning | new | time_to_days |
| Financial Planning | evayears | evayears |
| Financial Planning | years to time | years_to_time |
| Financial Planning | cascade_volume | cascade_volume |
| Financial Planning | band_allocation | band_allocation |
| Financial Planning | new | dispatch |
| Financial Planning | new | nvx_read_multi_sheets |
| Financial Planning | new | nvx_smart_pandas |
| Financial Planning | new | nvx_round |
| Financial Planning | new | nvx_safe_int_div |
Use these functions as you used them in Cubeplan.
